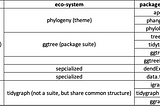
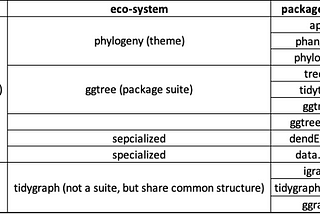
The evolution of specialized R packages for trees and graphs/networksSome personal background: (feel free to jump to first table below if you wish)Jan 14, 2023Jan 14, 2023
Published inTDS ArchiveThe Essence of R’s expand.grid() FunctionA love letter to a function that says it allDec 9, 20211Dec 9, 20211
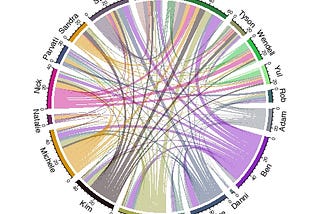
Published inTDS ArchiveVisualizing Survivors TV show data set: castaways personalities and voting teams patternsAs a teenager, I remember the excitement around each new episode of the reality TV show ‘Survivors’. While the viewers were given close to…Feb 19, 2021Feb 19, 2021
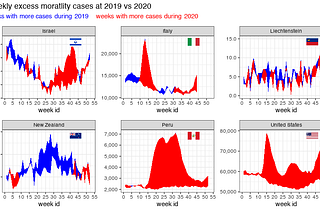
Published inTDS ArchiveVisualize excess mortality across countries during the COVID-19The most exciting event for my kids, specially during COVID-19 times, is to open delivery boxes that arrive to our front door almost on a…Feb 1, 2021Feb 1, 2021
Published inTDS ArchiveHow to create a race bar animated plot in a single-long-piped R line of codePerhaps not the most elegant way to do it, but worth it for the catchy titleOct 26, 20201Oct 26, 20201
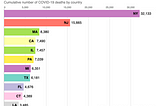
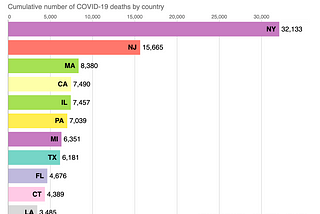
COVID-19 death visualization: race bar chart for US states5 minutes to create the animation. 50 minutes to load into MediumOct 24, 2020Oct 24, 2020
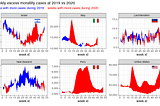
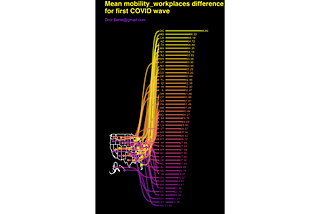
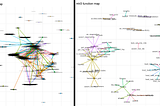
Published inTDS ArchiveRanking recovery of US states after COVID-19 first wave, using Google mobility dataVisualizing Saxophone graphs and measure mobility trendsOct 7, 2020Oct 7, 2020
Published inTDS ArchiveHow to choose the software package with the widest scope?From a data-science perspective.Oct 4, 2020Oct 4, 2020
Published inAnalytics VidhyaMeta Machine Learning aggregator packages in R: Round IIwritten on December, 2019.Dec 14, 20191Dec 14, 20191
Published inWe’ve moved to freeCodeCamp.org/newsHow to avoid scope creep, and other software design lessons learned the hard wayDisclaimer: From a data-science perspective.Feb 15, 2019Feb 15, 2019